Self-Service Performance Tuning for Hive (en inglés)
In this article, we will analyze how to monitor metrics, tune and optimize the workflow in this environment with Dr. Elephant.
Hive is a very powerful data warehouse framework based on Apache Hadoop. The two together provide stable storing and processing capabilities for big data analysis. Is designed to enable easy data summarization, ad-hoc queries, and big data analysis. It provides SQL capabilities to users, which make the exploration of the structured data saved in HDFS (Hadoop Distributed File System) easily and fast.
Given the high complexity of this large and complex framework, it is really important to ensure that every component performs optimally. While we can always optimize the underlying hardware resources, network infrastructure, operating system, and other components of the stack, users only have control over optimization of the jobs that run on the cluster
At BBVA Data & Analytics, we have staff with different levels of expertise with Hadoop, using different frameworks to run their Hive jobs. In order to help users understand and optimize their flows, we scheduled some regular training sessions about how to tune Hive jobs.
Lately, we have been testing a tool that helps users to understand, analyze, and improve the performance of their flows: Dr. Elephant, open sourced by Linkedin. This is a performance monitoring and tuning tool for Hadoop and Spark. It automatically gathers all metrics, runs analysis on them, and presents results in a simple way for easy consumption. Its goal is to improve productivity and increase cluster efficiency by making it easier to tune the jobs.
We have identified three key features that may help anyone tuning their jobs using this tool with Cloudera Hive 1.1.0 and MapReduce as the engine.
Tuning number of mappers and reducers
When the number of mappers or reducers are not correctly adjusted the task will suffer from performance issues and the task will slow down.
Number of Mappers
Let’s start our analysis with some common problems which involve a wrong definition of the number of mappers. An excessive number of mappers can be produced by small files in HDFS. Small files cause HDFS file system to not reach configured block size, which is a known HDFS performance problem. The harmful effects will be: NameNode service overloaded due to the high number of processes, task performance slows down due to container instantiation and finally, an excessive number of small output files, so the problem aggravates.
On the other hand, an insufficient number of mappers may be caused by huge files in HDFS so the job does not have enough parallelism.
Within Dr. Elephant, we can use the MAPPER TIME metrics to detect these problems and solve them. In essence, these metrics specify the problem severity and attach an link “Explain that details the possible causes and suggests solutions.
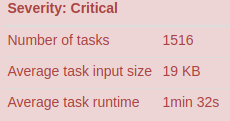
When the metrics show a low “Average task runtime” (in the order of several seconds or few minutes), a low “Average task input size” (only a few MB or KB) and a high “Number of tasks” (maybe a few thousands) it means that the number of mappers is excessive.
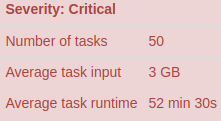
When the metrics show a high “Average task runtime” (around one hour or more), a high “Average task input size” (several GB) and a low “Number of tasks” (some tens) it means that the number of mappers is not enough.
The suggested solution for Hive is tuning the parameters that adjust the input file size:
mapreduce.input.fileinputformat.split.maxsize
mapreduce.input.fileinputformat.split.minsize
When the files are small, by setting the correct mapreduce.input.fileinputformat.split.minsize the files will be merged to reach at least the size indicated in the parameter before the data will be passed to the mappers process.
Tip: Review that the parameter hive.input.format is correctly set to permit the file merging.
hive.input.format=org.apache.hadoop.hive.ql.io.CombineHiveInputFormat
Number of reducers
Now, let’s focus on the number of reducers. The excessive or insufficient number of reducers cause the task to slow down. At the same time, an excessive number of reducers can generate small files in HDFS perpetuating the problem with mappers. In Dr. Elephant, the REDUCER TIME metrics help to detect these problems.
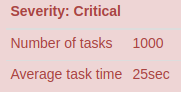
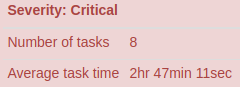
When the metrics show a low “Average task time” (only several seconds or few minutes) and a high “Number of tasks” (maybe a few thousand) it entails that the number of reducers is excessive.
When the metrics show a high “Average task time” (one hour or more) and a low “Number of tasks” (some tens or less) it means that the number of reducers is not enough.
The suggested solution of Dr. Elephant is to explicitly set the estimated number of reducers or the number of bytes to process for every reducer:
mapreduce.job.reduces
hive.exec.reducers.bytes.per.reducer
Tip: If you need a lot of reducers make sure that the parameter hive.exec.reducers.max is not limiting you.
hive.exec.reducers.max=1999
Merge small files
A nice feature in Hive is the automatic merging of small files, this solves the problem of generating small files in HDFS as a result of the number of mappers and reducers in the task. It can be set only in map tasks (parameter hive.merge.mapfiles) and mapreduce tasks (parameter hive.merge.mapredfiles) assigning a true value to the parameters below:
hive.merge.mapfiles=true
hive.merge.mapredfiles=true
In the same way, we need to set the threshold that launches an “automerge” stage with the parameter hive.merge.smallfiles.avgsize. If the average size of the resulting files is below the value set, a new stage will be launched to merge the output. You can use the block size, in the example below 128MB (134217728 in bytes).
hive.merge.smallfiles.avgsize=134217728
The files are merged to be at least of the size in bytes indicated with the value of the parameter hive.merge.size.per.task. It must generate files of several blocks, in the example below 8 blocks of 128MB.
hive.merge.size.per.task=1073741824
Tip: If the data are stored in ORC format you must review that the parameter hive.merge.orcfile.stripe.level is set to false.
hive.merge.orcfile.stripe.level=FALSE
Identifying wasted memory
A common mistake made by users when trying to increase the performance of their queries is tuning the memory assigned to mappers and reducers to high values, even if it is not necessary. Dr. Elephant can surface these mistakes with two groups of metrics,
MAPPER MEMORY, and REDUCER MEMORY
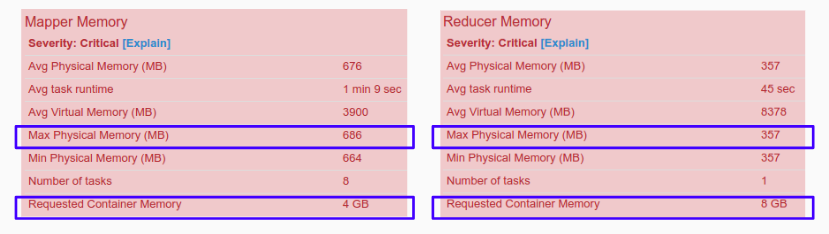
Increasing mappers and reducers’ memory does not necessarily entail an increase in query performance. In order to find out how memory is allocated in our jobs, we can check the metric “Requested Container memory”, which shows the memory size of memory reserved by the mappers and reducers containers. Another useful metric is the “Max Physical Memory”, that tells us the max size of memory actually used by the mappers or reducers.
Both values should be similar to ensure a proper use of the requested memory. For instance, a task is clearly ill-defined when the memory usage is much lower than the requested memory, mainly because the task is wasting memory.
In these situations, Dr. Elephant helps to tune the memory of mappers and reducers. Using the “Max Physical Memory” value defined before plus 1GB — Yarn containers are JVM processes and need extra memory for code and internal structures — we can set the mappers and reducers initial memory size to that value and adjust again in the next execution. So, looking at the above example, where the upper limit of memory for mappers and reducers was 686MB and 357MB respectively, we could now suggest a 1,5GB (1536MB) values for both memory parameters:
mapreduce.map.memory.mb=1536
mapreduce.reduce.memory.mb=1536
Tip 1: Remember that mappers and reducers’ size is limited by the yarn container size. Do revise the value of the parameter yarn.scheduler.maximum-allocation-mb before you increase the size too much. As an example, the following line defines a container with 16GB of maximum size so you can not rebase that limit:
yarn.scheduler.maximum-allocation-mb=16384
Tip 2: Our recommendation is to set the JVM heap as 80% of the container memory. You may change the ratio for all container types (mappers and reducers) with the parameter:
mapreduce.job.heap.memory-mb.ratio=0.8
or set different values for mappers and reducers setting Java opts parameters:
mapreduce.map.memory.mb=4096
mapreduce.map.java.opts=-Xmx3276m
mapreduce.reduce.memory.mb=6144
mapreduce.reduce.java.opts=-Xmx4915m
Dealing with skewed data
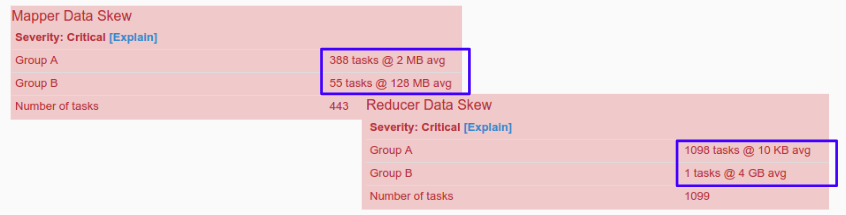
Data skew comes up when a small number of containers (either mappers or reducers) have to process almost all the amount of data. For instance, skewness is characterized by two groups of data, one with a high number of tasks and small average size, and the other with a few numbers of tasks and high average size.
Skewed data impacts the global execution time of the tasks, as the volume of data among processes is distributed unequally.
Dr. Elephant has two groups of metrics that help you detect data skewness in map and reduce stages. These are MAPPER DATA SKEW and REDUCER DATA SKEW groups.
Consider first the case in which the mapper data is skewed. Here you can set the parameters that split or combine the input file according to the “Tuning number of mappers” section. In the same way, you can use the “slowstart” parameter (mapreduce.job.reduce.slowstart.completedmaps) to mitigate the delay at the beginning of the reducer stage.
In the reducer case, skewness could be caused either by duplicated keys in joined queries or by aggregation keys in “group by” queries. At this point, you could analyze the source data and try to solve the problem rewriting the query. In other cases, you may use the Hive skewed join or skewed “group by” optimization. In particular, this optimization detects the skew and launches a new stage that processes only the skewed data set in a more parallel and distributed way.
Concerning parameter configuration, you may enable the skewed join optimization using the following parameters:
hive.optimize.skewjoin=true
hive.optimize.skewjoin.compiletime=true
You also need to define a skewness threshold, defined as the number of records from which a data set can be considered skewed (it depends on the size of the data set!):
hive.skewjoin.key=100000
Moreover, in the “group by” skewed optimization you need to activate the below-indicated Hive parameter. Besides that you should also set the number of records as before:
hive.groupby.skewindata=true
hive.skewjoin.key=100000
Finally, to “fine” tune the number of mappers to use in the new stage you should use hive.skewjoin.mapjoin.map.tasks, and hive.skewjoin.mapjoin.min.split parameters to define the desired parallelism and the size of the fragments in which the skewed data are divided. In the next example these two parameters take the default values of 10000 mappers and 32MB respectively:
hive.skewjoin.mapjoin.map.tasks=10000
hive.skewjoin.mapjoin.min.split=33554432
That’s all! We hope that this brief introduction will serve as a starting point to benefit from the “diagnoses” provided by Dr. Elephant.