Measuring People’s Economic Resilience to Natural Disasters
We have been publishing research papers demonstrating that bank card transaction data is a resource that can provide insights into economic activity in a more timely fashion and with greater granularity than traditional methods. For instance:
- Scaling of city attractiveness for foreign visitors through big data of human economical and social media activity.
- Money on the move: Big data of bank card transactions as the new proxy for human mobility patterns and regional delineation. the case of residents and foreign visitors in spain.
- Mining Urban Performance: Scale-Independent Classification of Cities Based on Individual Economic Transactions.
- Predicting regional economic indices using big data of individual bank card transactions.
- Evaluating uncertainty scores for deep regression networks in financial short time series forecasting.
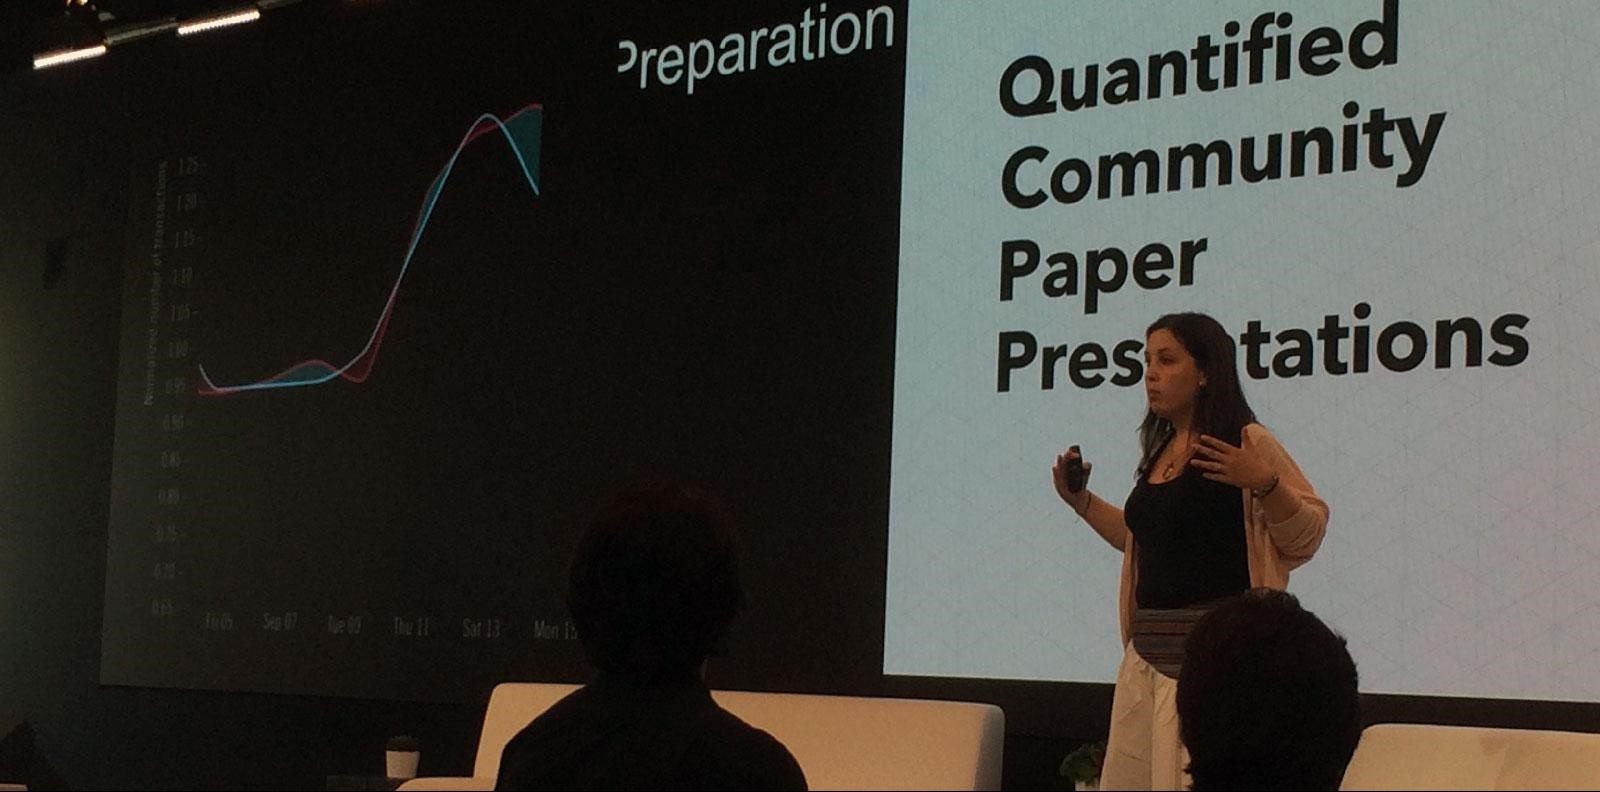
This year, as part of our Data for Social Good initiative, we collaborated with United Nations Global Pulse to create new approaches of big data analytics for humanitarian action. Our results showed a replicable and evidence-based approach to understanding economic vulnerability1. Here is an approximate transcript of my presentation of that research work at the Bloomberg Data For Good Exchange conference in New York.
Hello! My name is Maria, I am a data scientist, member of BBVA Data & Analytics, an excellence center in financial data analytics. We all know that floods and earthquakes, hurricanes or fast-moving epidemics all represent a risk to economic sustainability of regions. I will present you the results of an analysis of aggregated bank card transactions to measure the economic impact of Hurricane Odile that hit the Baja California Sur peninsula in Mexico in 2014. That work was conducted in collaboration with United Nations Global Pulse and BBVA Bancomer.
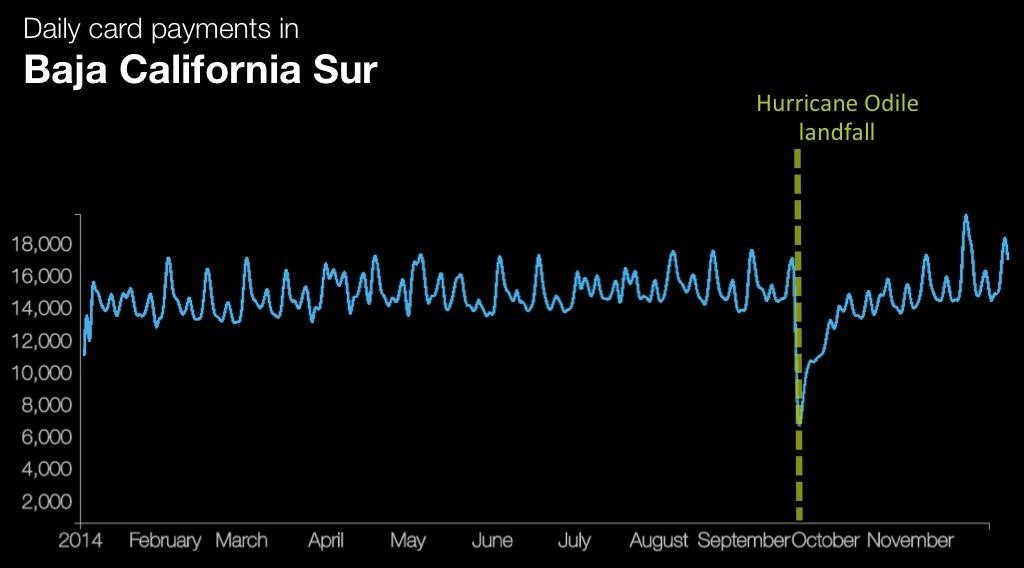
If we look at Baja California Sur in 2014, we can observe that BBVA Bancomer customers generally created around 15.000 card transactions every day. This is the pulse of the peninsula. Its rhythm looks normal until Hurricane Odile hits the area. Odile was a category 3 hurricane, with wind speed reaching 200 km per hour. It proved one of the most destructive hurricane in the recent years. With that observation we asked ourselves:
- Can we measure the economical impact of a natural event?
- Can we measure how people change habits in order to prepare for a disaster?
- Different groups act or recover in different ways? Which are the most vulnerable groups?
Here is how we answered these questions:
BBVA Bancomer is the main financial institution in Baja California Sur with 25.000 card payments per day, including Point of Sales and ATM cash withdrawals. This means that the studied population represented 30% of all bank account holders (i.e. approximately 100.000 active customers) with annonymized and aggregated transactions, grouped by gender and income level.
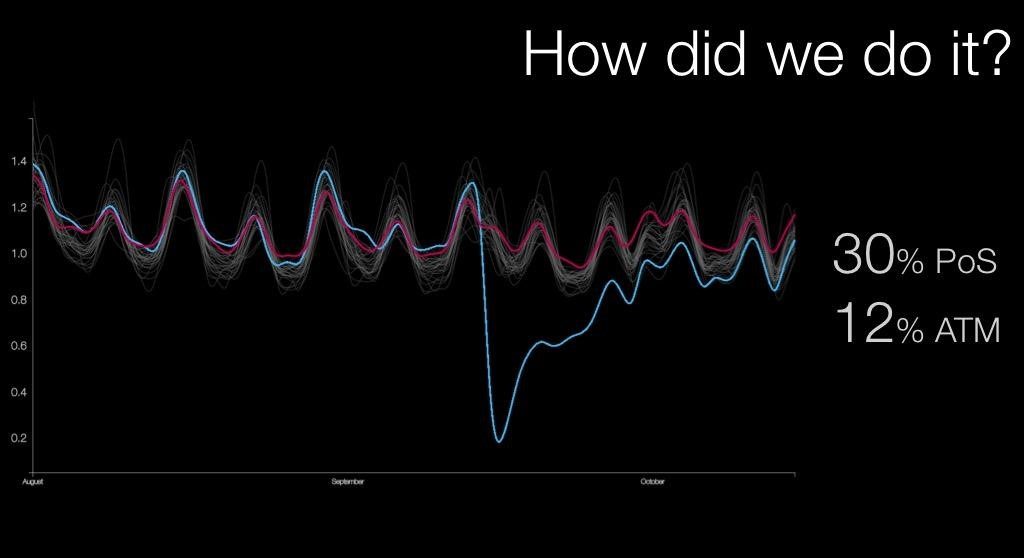
The effect of the hurricane on card payments is big, dropping near zero (blue line). By looking at other unaffected regions in Mexico (gray lines), we built a model that estimate the expected activity in Baja California Sur by comparing with the ones that had the most similar behavior in the past.
Using that estimation, we can measure how different the real and the expected series are. The difference represents the activity that did not occur because of the hurricane. Practically, 30% fewer card transactions and 12% less cash withdrawn were made in the month after the hurricane.
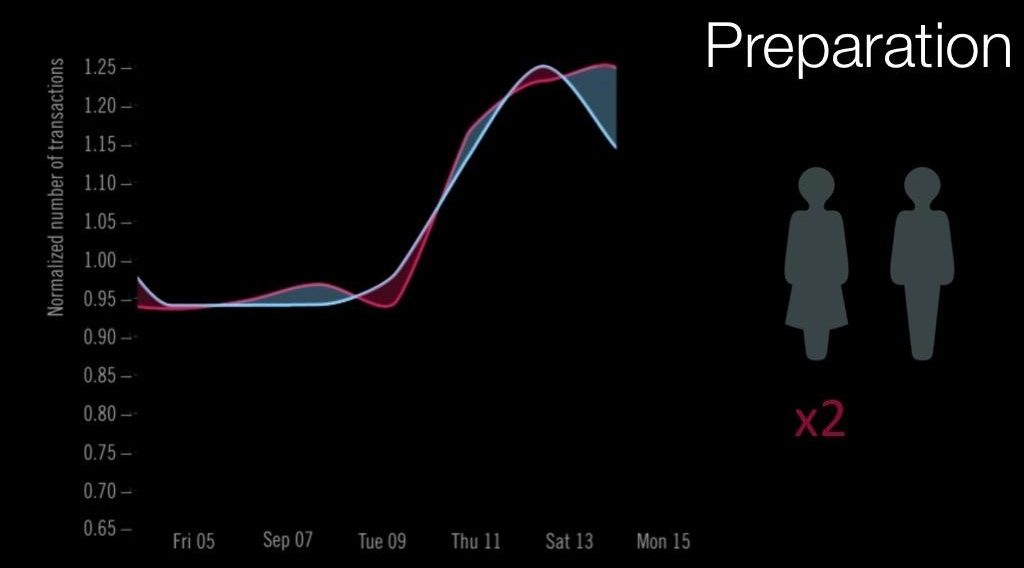
As it is a hurricane, the population was aware of the moment of the landfall and took the necessary actions. By looking at how consumption patterns changed the day before the hurricane struck, we can see that women spent almost twice as much as men compared to the expected consumption of both groups.
In terms of payment categories, groceries and fuel transactions increased by 20% and other less vital activities, such as restaurants, decreased by almost 40%. This is a pretty obvious result that endorses that our model is able to capture the people’s pattern and strengths our findings. Additionally, we were able to measure that people take in general 22 days to resume their normal payment activity.
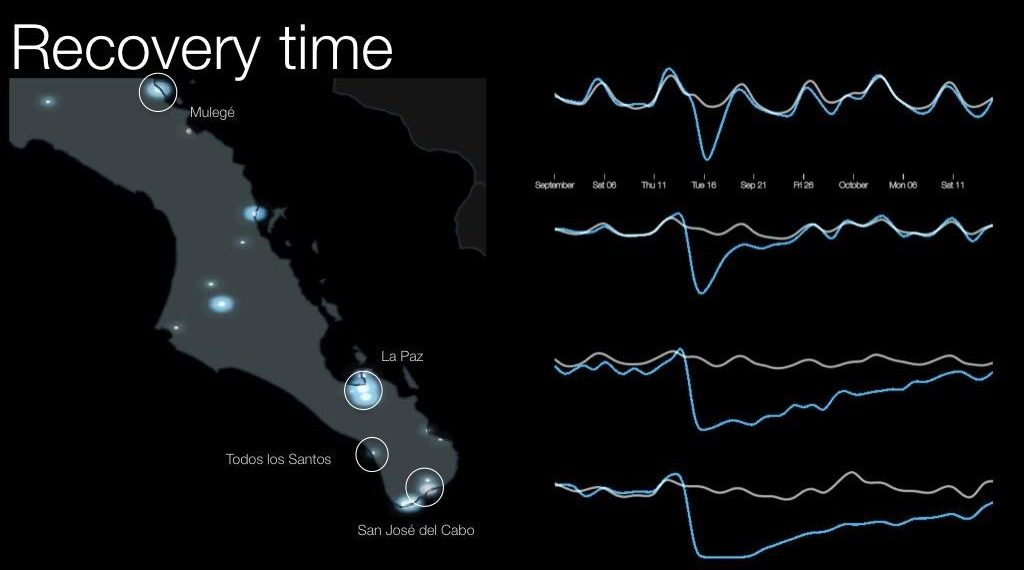
However, different areas recovered at different rhythms. Here you can see that southernmost regions were more deeply affected. For example, San José del Cabo needed 40 days to recover whereas Mulegé in the north is barely affected with only 2 days to get back to normal activity. Notice also that La Paz, very close to Todos los Santos, is not as affected as expected potentially because it is a fairly large city and, therefore, more resilient. In terms of income, individuals with a higher income took longer than others to recover. You can find these and many other results in the interactive data story of where you can explore more about the story of this hurricane and our study.I also invite you to look and share the video of the study.
In this research, we have demonstrated that we can understand the impact of a hurricane at different stages of its evolution. Based on transactional data, we can estimate the preparation the days before, the local economic impact and the recovery after a shock. We believe that these types of insights can help authorities improve community resilience, which benefits the vulnerable and is also good for business continuity.
This is the first study of its class and further research is needed to understand how different disasters affect the population and whether they share a similar pattern. We also think that building tools that help to monitor this data in real time will drastically reduce the uncertainty of the decisions made on the ground.