Rediscovering Cities through Credit Card Data (Part 2)
In a previous paper we outlined the methodology, models, and tools used for the analytical and graphical representation of the Urban Discovery project that we developed together with CARTO. In this second part, the focus is on the functionality of the results in order to interpret and improve the administration of the territory by using new high-resolution spatiotemporal data sources. Specifically, we worked with massive data sets from bankcard payments, which allow us to gain new insights into what is occurring in terms of retail commerce. We will then explore how this data strongly reflects the urban reality.
Concerning the territorial organization of cities: what are the districts and neighborhoods, how are they identified and why are they used?
With the aim of decentralizing the city’s governance and optimizing the provision of public services, the municipal districts of large cities are subdivided into smaller territorial units. Hence, 16 districts were identified in Mexico City in 1970; Madrid has been organized into 21 districts since 1988; and Barcelona into 19 districts since 1984. These subdivisions were defined on the basis of both historical criteria (the absorbed municipalities tend to become districts once they are integrated) and practical criteria: within a given range, we aim for a certain degree of consistency in terms of demographics and territory. It should be taken into account that the units which emerge from this first administrative breakdown often have a population size similar to many medium sized cities (the districts in Mexico City – which will be known as ‘alcaldías’ in 2018 – are home to around 500.000 inhabitants, whilst those in Madrid and Barcelona have an average population of around 150.000). We therefore require a more granular level: as a result, we find the neighborhoods (barrios) in Barcelona and Madrid (around 20.000 inhabitants) and the ‘colonias’ in Mexico City (around 4.000). The redefinition of these second-tier administrative areas is more frequent (here is an example of the process and criteria applied), even though, they are still based on static data.
Nowadays we have access to new sources of information that reflect how locals and visitors really make use of cities. This data should be taken into account when drawing districts and neighborhoods boundaries because it will subsequently exert an influence on various aspects of citizens’ lives such as getting around the city (parking constraints areas in Madrid are linked to the neighborhoods), or schooling (in Barcelona places at primary and secondary schools are awarded on the basis of official districts).
Using new dynamic data sources to gain a better insight into the territory
Anybody visiting or living in a large city will rarely take it all in: we end up scaling it down to a limited area based on where we live, work, study, or where we spend our free time or engage in leisure activities. All this leaves behind a digital print that generates connections between different areas. Over the last 5 years our workgroup has been using one of the aforementioned sources of data: bank card payments. This data is able to portray how citizens make use of the services that a city offers through its network of retail trade and leisure, (see Big Data to Enhance the Tourism in Mexico or Urban Analytics to Measure the Economic Impact of Traffic Calming ,for example).
Even though we are dealing with a partial source of data that describes only one of many urban reality systems – relationship retail/territory – it does correspond with one of the most important dynamics when trying to understand a city and its evolution. We shall see this hereafter.
On this occasion the aim of our project was twofold:
- To measure the degree of territorial cohesion of three large cities in order to obtain new delimitations -functional areas- based on actual activity of people when operating within the given environments.
- Tagging the functional areas identified.
We will not go into too much detail regarding the first objective: as described in the previous article, this was done by applying computer science to a massive set of card transactions data (over 413 million) in order to define what we now call macro communities – first-tier divisions akin to districts or municipalities – and communities, second-tier divisions, similar to neighborhoods. These are then used as small-scale units for the purpose of our second objective: tagging.
The ideal city and the real city: metrics and descriptors
The ideal city would be made up of neighborhoods that enjoy a degree of balance on all fronts. This would lead to greater self-sufficiency and less dependence on logistics of supply.
- Balance of space: the polycentric city, one with surrounding areas that complement the functions of its main center. This would create smoother transport links compared to territories which are purely radial.
- Balance of use: in order to combine different functions inside areas that are more self-sufficient in terms of residential capacity, employment opportunities and working places, or the supply of retail and leisure services.
- Sociodemographic balance and diversity in the population: in terms of age and gender, education, and income.
- Balance in terms of urban configuration, funding, existing facilities, and general appeal. Visitors should not be too concentrated so as to avoid overcrowding at places of interest for tourism, culture, and entertainment. This would therefore lessen the pressure on the property market in areas which are more privileged, more attractive, and better maintained.
Although earlier studies have shown that minor changes in patterns of consumption would favor urban rebalancing by making some of these partial objectives attainable, the truth is that cities are not even close to achieving this anti-hierarchical, egalitarian ideal.
Actual cities nowadays tend towards segregation and to the specialization of the neighborhoods, and this effects leave a digital footprint that we have read through the analysis of data relating to commercial activity. The information we had at hand has driven us to interesting insights and results.
To this end, we worked on three levels: firstly, we identified variables or basic metrics that were to be found in the information available; secondly, these variables helped us set out attributes of consumption as a combination of variables. We used these attributes as ‘area tags’ which can be divided into three types:
- Attributes relating to the commercial fabric and registered trade activity; general retail trade density, or density related to a particular business (e.g. convenience stores), average transaction in a given area, etc.
- Attributes relating to socio-demographic profile of consumers: a given predominant profile of cardholder.
- Attributes relating to time patterns: identifying regular spending patterns at certain intervals in time.
The third and final step is to create combinations of area labels that will define areas which share similarities from a sum of communities -not necessarily contiguous- with common characteristics. This is when strong links emerge between the retail activity and the various definitions used to describe an urban area type: such a reading produced results which are consistent in terms of timeline, urban space, and functionality. Nevertheless, the tags or names selected stem from this third aspect: the urban function, nevertheless, it is clear that those three aspect are linked. The geographical location of a given area is related to the different stages of growth in a city, and those imply different urban types of development, and commercial fabric. This, in turn, conditions the use that citizens make of the analyzed environment.
Results: Urban area types identified
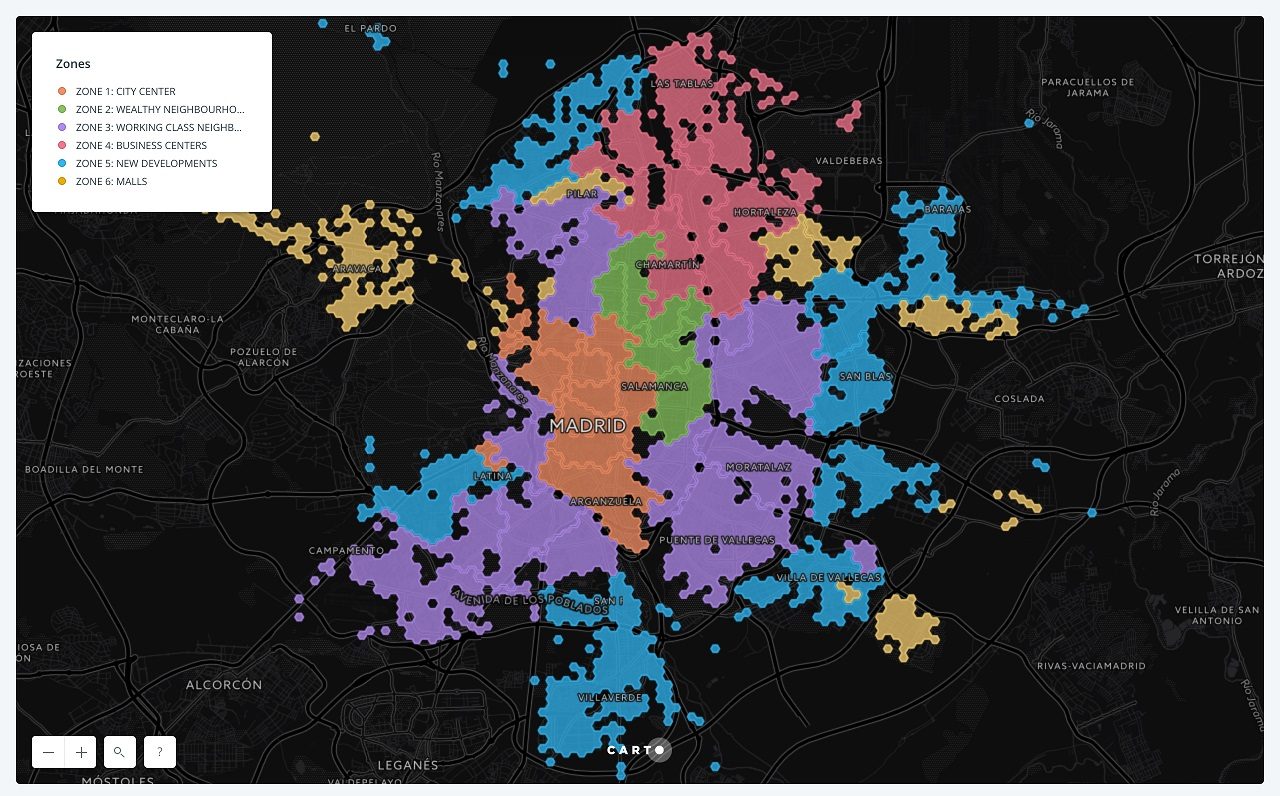
Based on common patterns of consumption, we identified six basic types of urban areas that make up a city. This taxonomy has been useful to create zones for the three large cities which are the subject of this paper. For future study the same approach could be applied to smaller urban areas (in terms of size and transactions):
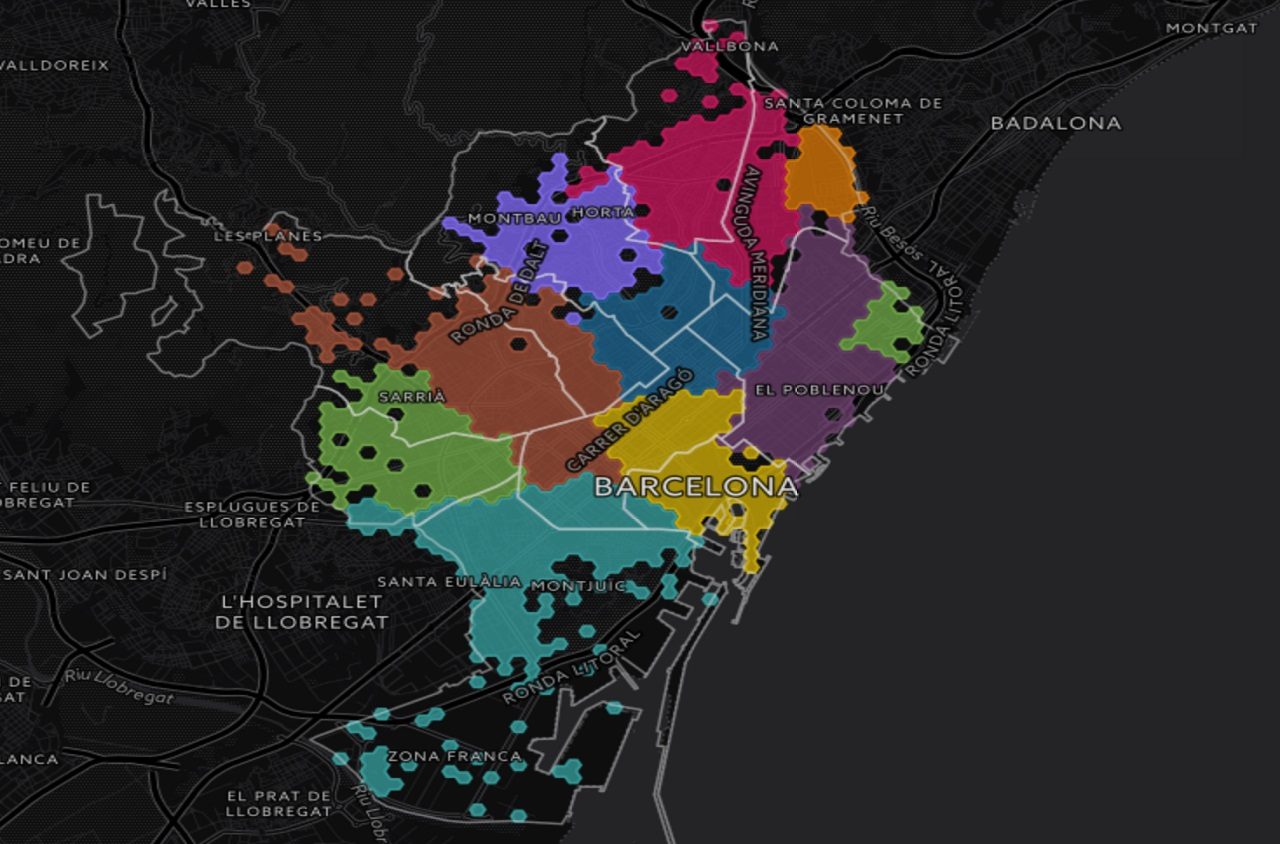
- Zone 1 – City Center: these are areas with a high volume of retail trade due to their dense urban fabric. Also found here are a number of retail premises at street level with high occupancy rates and above average retail activity. We find cultural venues (museums, bookstores). This part concentrates a higher activity of tourists (both from Spain and abroad) and cardholders who tend to spend more on culture and entertainment than users in other parts of town. This urban area includes the core city consolidated by 1900, innerly to the first ring perimeter of the city (Felipe IV wall), and besides Chamberi to the north, and Arganzuela to the south, and some parts of the new Castro development towards the east, that had not yet been completed by the beginning of 20th century. In Barcelona, this urban area embraces the Barrio Gòtico, together with the first part of the new Cerdá development that lies on both sides of the Gràcia axis. In any case, both these City Center areas are relatively much broader compared to the other parts of Madrid and Barcelona, than it is in the case of Mexico City, where what is considered the city center – coinciding with the extension of the city 100 years ago – has now been fairly diminished in size as a result of growth in other areas, where we find different characteristics and another type of digital print, as we shall see shortly.
- Zone 2 – Wealthy neighborhood: these are areas with high volumes of retail trade, as is the case with the City Center zone. This second zone tends to be contiguous with Zone 1 in terms of space, and of the period when it was developed. Indeed, the built-up areas of the wealthy neighborhoods were erected during the next phase, around 1940. However, these new areas differ from the center zones because we find here a cardholders with a higher purchasing power. We can also observe fewer landmarks for culture and entertainment, and not as many fashion retailers (particularly in Mexico City), even if there is relatively strong presence of foreign nationals.
- Zone 3 – Working Class Neighborhood: after much debate, this is the name we have assigned to the areas which were developed during the period of greatest growth for the cities included in the present study: the second half of the 20th century. This coincided with the arrival in the city of large numbers of people from the rural provinces. In order to cope with this demand for shelter, further expansion was undertaken following strict rationalistic parameters: the closed block is replaced with high structure open housing blocks, often with ground floor apartments instead of commercial premises. As a result, these are areas with low levels of retail trade, and where small local commerces and convenience stores (bakeries, hardware stores, pharmacies, small food stores) play an important role. We have here lower-middle range payments and low spending at weekends. This urban area in Madrid lies on the central periphery (the arch between the M30 and M40). However, there are similar zones with the same digital print which are also inside the central core: a case in point is Tetuán. In Barcelona these zones are concentrated to the north of the city: Horta-Guinardó, Nou Barris, while in Mexico City they dot the territorial demarcation of the largest of them all, Iztapalapa, where these attributes are most present.
- Zone 4 – Business Centers: office or industrial areas where we typically find very low activity at weekends. This is due to its low-density commercial fabric that includes mainly bars and restaurants which serve the employees from the business centers. In Madrid most of these offices are located in the north of the city –results confirm this – leading to very clear commuting patterns: northbound during the mornings, and southbound in the afternoons; further detailed studies of these flows could be carried out in the future assuming that the place of origin of chains of transactions is the hexagon where the card holder resides. In Mexico City, Miguel Hidalgo, Azcapotzalco, and Cuajimalpa de Morelo fall under this category, while in Barcelona we do not find any zones with said attributes. This last in itself is positive, as it implies that the business centers in Barcelona are well integrated inside the urban environment and do not influence time schedules; In Madrid this can be seen at AZCA and Castellana, where we find not only numerous office spaces, but also a residential area with services and local entertainment, meaning that the area is active outside office hours.
- Zone 5: New developments: this is how we have tagged the areas which are similar to the residential zones (low retail activity, no tourists), but where we find a lower average age, and spending mainly at weekends. From an urban perspective, these zones reflect a recent development in cities, where residents will spend little time in the neighborhood during the week, and consume chiefly at weekends. In Madrid we find the new developments in the city outskirts, mainly outside the M40 ring road. However, there are cases (Las Tablas, Sanchinarro) when this urban area can be overshadowed by the Business center zone. Nevertheless, rather than excluding one another, they are in fact complementary. In Barcelona this urban area is found in the area of the Villa Olímpica, and also in the north of the city. In Mexico City these areas occupy large spaces at the four points of the compass.
- Zone 6: Malls: these are areas with very low retail activity, and where spending takes place mainly in large surfaces (hypermarkets, multi-product stores, department stores). The urban areas linked to this digital print are very diverse: in Madrid we find urban sprawl areas such as Aravaca, but also other densely populated residential areas such as those close to La Vaguada, together with medium density or more condensed areas such as La Gavia. In Barcelona we find the 22@ neighborhood (where the Diagonal Mar shopping mall leads the way, prevailing over the pace set by the neighboring offices). Lastly, we can see this type of urban area in Mexico City with malls located along Avenida de Miguel Ángel Quevedo and Calzada del Hueso. We need, however, to bear in mind that we have worked with attributes that are relative, and that there are certainly other shopping malls with more activity in other areas coexisting with other types of activities, but which do not manifest an independent zone pattern.
In conclusion, we would like to remind that all this information can be directly downloaded to be used again in future studies. This paper should be seen as a starting point from which to carry on producing and generating related research. At some stage down the line it would be interesting to observe the evolution of the specific attributes over time. This could be useful to shed light on phenomena such as gentrification or touristification. Nonetheless, we would need to base this type of study on a more detailed taxonomy of categories.
In the meantime it is our view that the first objective has been reached: to demonstrate that our sources and methodology can serve to explore the dynamics of our cities through another prism. However, the descriptive capacity of the consumer data goes much further, and will become increasingly transverse when in combination with other data sources.
Beyond the academic value that this research may have, these results may become the foundations of practical tools to guide a broad range of decisions from citizens, corporations or governments: the identification of twin areas in different cities to seek accommodation or to expand a business is just one example. The use cases are numerous, and we believe in the innovative ability of the society to propose solutions upon this data, that are available through BBVA API Market.